Note from February 9, 2020: I’ve redone this analysis for the forthcoming non-fiction book, The Future without Animal Products. There are some major flaws here that I’ve corrected, and the work is being reviewed by some scientific peers. Anyway, the book’s version should be vastly improved and more understandable. Stay tuned.
Why are animals a terrible technology? I need to introduce (bio)chemical engineering before ushering some illuminating numbers. Biochemical engineers seek to make biologically-derived commodities in the best way possible. Engineers at Eli Lilly wring insulin from modified bacteria grown in large bioreactors in order to dispense the therapeutic protein into bottles found at the pharmacy. Berkeley scientists successfully engineered the same yeast we use to brew beer to instead brew malaria-fighting drugs.
What falls into the purview of biochemical engineering? A biochemical engineer’s hand will touch the production of beer, bread, and meat. Meat is certainly biologically-derived. Animals, in biochemical engineering terms, are meat reactors. They receive an input of air, food, water, and antibiotics and produce a commodity, meat. Therefore, I can assess meat production on the same terms as any other biochemical engineering process.
Chemical engineers—especially biochemical engineers—fixate on numbers for good reason. How much product can we generate from a certain amount of input? How fast can we generate product? Entire industries will form and fold because of such numbers. For example, during the early European Industrial Revolution, industrialists needed a more efficient way to make alkali, a common ingredient in soap. Up until that point, soap makers had burned seaweed and harvested the alkali from the ash. Sounds like it was an efficient process! In 1789, a French scientist Nicolas Le Blanc developed a process to convert salts to alkalis. However, the Le Blanc process was not financially tenable until a special exception to the salt taxes was granted. Afterwards, the salt input was cheap enough to develop the Le Blanc process further. If the taxes had been levied, the salt to alkali revolution would have waited [1].
Clearly the numbers for any industrial process matter. The numbers set the process viability and the standard for prospective competition. We need to know such numbers for meat production so that we can adjust the rifle scope of animal-free alternatives. I will not satisfy this theme in one blog post. I will continuously revisit the Animals by the Numbers topic. By the end, I hope to leave a useful compendium of metrics.
For this post, I discuss two quantities: biomass and maintenance. For any biological system, there is a required input. All life requires water and basic chemical elements including carbon, nitrogen, phosphorus, etc. This input is chemically converted by the biological system into roughly three products: biomass, maintenance, and waste. In adolescence, mammals grow at their fastest. For anyone who has raised a dog from a puppy will know that they explode in growth within a relatively short time:

This growth in size is founded in the puppy’s ability to generate biomass from food, the nutritional input. Biomass is the physical mass generated. As the puppy concludes adolescence, the now dog stops adding biomass and stays roughly the same size for the rest of life; this is termed as the ontogenetic model. The dog still requires food, but this input supplies something else: maintenance and waste. Maintenance refers to the renewal of dying cells and the generation of energy so that the dog can perform running, thinking, and barking. (Probably not all at the same magnitude.) The line between maintenance and waste blurs. Waste is coupled to maintenance and biomass-forming reactions; therefore, I will ignore it and just refer to biomass and maintenance for now. Metabolic maintenance analogizes to a car running on gasoline or a LCD display depleting a battery. Biological life has evolved a way to execute mental procedures, experience emotions, and perform physical actions powered by the food consumed.
We also intuit that this ontogenetic model applies to other animals such as cats, fish, elephants, cows, and even ourselves. Less obviously, not all domains of life follow this trajectory. For example, microbes such as bacteria and yeast do not adhere to the ontogenetic model. Accordingly they have less maintenance requirements (relative to their consumption). These biological entities will actually use far more of the metabolic input to construct biomass compared to complex animals. Why does this matter? Because meat is part of the biomass. A cow is a reactor for making burgers. If I want to optimize the reactor, I would want as little of the input to be wasted on maintenance and the majority to be going to the biomass. That would achieve the best possible yield, or amount of production per unit of input. Improving yield helps our process be more efficient and competitive.
So exactly how do different organisms compare in terms of the ratio of maintenance versus biomass? I can use a formula:
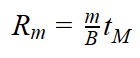
The ratio maintenance Rm encapsulates the message. It quantifies how much a biological organism allocates to maintenance (m) versus the amount to biomass synthesis (B), all multiplied by the maturation time (tM). If you wish to read how I developed this calculation, you can do so below in the Appendix. The bigger Rm means that more of the metabolic input goes to maintenance versus creating new biomass. If I were designing a meat-making process, I’d ideally want Rm as small as possible, everything else being equal, so that I maximize my yield. Let’s further assume that I could make the meat out of any biological substrate (cow vs. lettuce vs. yeast). How does Rm compare across biological organisms?

Higher animals (e.g. mammals) have a terrible Rm. By the time they have matured, they will have used at least 10 times more resources toward maintenance versus making biomass. Microbes perform the opposite, they commit around 10 times more resources toward making biomass versus maintenance. Therefore, if I’m designing my process to make a burger from any biological substrate, I’d want to strongly consider a microbe like yeast, which FYI is ~40% protein by dry mass. The yeast would use about 100 times less resources compared to a higher animal for the same amount of biomass (meat).
I’m acutely aware of the oversimplifications with this analysis. For example, yeast and cows have seemingly very different food inputs. Nonetheless, I hope to stoke your imagination of the possibilities and highlight how much better these possibilities can be. Let’s imagine that we could take the same grass fed to cows, digest it to constituent sugars, feed to yeast, and form that yeast into a tasty burger patty. We’d have a patty with a lot of protein, not so much fat (~0.5% by mass), and something much more efficient compared to a beef burger. Furthermore, if yield was the sole metric that dictated the process’ success, then our yeast burger process would be about 100 times better.
Obviously, this is just one metric. I doubt that this kind of yield would swing an industry because the input, grass, is literally dirt cheap. That is okay because animal technology will not fare well according to other metrics.
Thanks for reading,
Karthik
Summary:
The efficiency numbers make or break a production process. Meat production efficiency partly equates to the animals’ ability to make biomass from food. However, animals waste most of the food to power their biological maintenance and not to create biomass. Microbes, such as yeast, convert 100 times more of the food to biomass compared to animals. Yeast burger, anyone?
Other notes:
- We can quibble about the exact numbers, but this kind of analysis is best when we differentiate by orders of magnitude. If yeast was only about 1.6 times better, then I would not have written this post.
- The list for the Rm is hardly exhaustive. The animal values will be within the same order of magnitude. In particular, I did not find a good resource for plant values. I am assuming that plants are all within the same range. The plant value shown is just for lettuce. However, other sources suggest similar values for other plants [5].
- In vitro meat (from animal stem cells) don’t have to be ontogenetic. Theoretically, under the right conditions, the input could be used to primarily make biomass. Therefore, they may achieve a much better Rm.
Key words:
- Biomass – The physical mass generated by a biological entity. Comprised of protein, fat, DNA, vitamins, etc. Meat is part of biomass.
- Maintenance – The energy required to sustain a biological, living mass. Exact details are still not well understood, but can be measured empirically.
- Yield – The amount of product generated per input. A useful metric in (bio)chemical engineering.
- Ontogenetic – The development model of most complex, multicellular organisms where the adolescent period of rapid growth is eventually punctuated with non-growing adulthood.
Appendix
In two studies that examined ontogenetic growth [2][3], the b value is the maintenance energy requirement over the energy needed to create new biomass. This value b is easily calculated with the right equation or directly given in the aforementioned studies. Rm is b times the maturation time. Maturation time can be solved for animals by taking equation (5) from [2] and solving for the time assuming that maturation occurs at 95% of asymptotic mass. For microbes, maturation time is taken as the inverse of the growth rate. For lettuce, a range of Rm is given in [4]. All calculations (iPython notebook) are freely available on Github.
References
[1] Donald L. Katz, ‘History of Chemical Engineering, William F. Furter, Editor, Advances in Chemistry, Series 190, American Chemical Society, Washington, D.C. (1980)
[2] G. B. West, J. H. Brown, and B. J. Enquist, ‘A General Model for Ontogenetic Growth’, Nature, 413.6856 (2001), 628–31
[3] Christopher P. Kempes, Stephanie Dutkiewicz, and Michael J. Follows, ‘Growth, Metabolic Partitioning, and the Size of Microorganisms’, Proceedings of the National Academy of Sciences of the United States of America, 109.2 (2012), 495–500
[4] M. W. Van Iersel, ‘Carbon Use Efficiency Depends on Growth Respiration, Maintenance Respiration, and Relative Growth Rate. A Case Study with Lettuce’, Plant Cell and Environment, 26.9 (2003), 1441–49
[5] M. Lotscher, K. Klumpp, and H. Schnyder, ‘Growth and Maintenance Respiration for Individual Plants in Hierarchically Structured Canopies of Medicago Sativa and Helianthus Annuus: The Contribution of Current and Old Assimilates’, New Phytologist, 164.2 (2004), 305–16

2 thoughts on “Animals by the Numbers #1 – Biomass and Maintenance”